Showing posts with label arc. Show all posts

How Hacker News ranking really works: scoring, controversy, and penalties

The basic formula for Hacker News ranking has been known for years, but questions remained. Does the published code give the real algorithm? Are rankings purely based on votes or do invisible factors come into play? Do stories about the NSA get pushed down in the rankings? Why did that popular story suddenly disappear from the front page after you commented on it?

By carefully analyzing the top 60 HN stories for several days, I can answer those questions and more. The published formula is mostly accurate. There is much more tweaking of rankings than you'd expect, with 20% of front-page stories getting penalized in various ways. Anything with "NSA" in the title is penalized and drops off quickly. A "controversial" story gets severely penalized after hitting 40 comments. This article describes scoring and penalties in detail. [Edit: HN no longer penalizes NSA articles (details).]

How ranking works

Articles are scored based on their upvote score, the time since the article was submitted, and various penalties using the following formula: score=\frac{ \left( votes-1 \right) ^{.8}}{ \left( age _{hours} + 2 \right) ^ {1.8}} * penalties

Because the time has a larger exponent than the votes, an article's score will eventually drop to zero, so nothing stays on the front page too long. This exponent is known as gravity.

You might expect that every time you visit Hacker News, the stories are scored by the above formula and sorted to determine their rankings. But for efficiency, stories are individually reranked only occasionally. When a story is upvoted, it is reranked and moved up or down the list to its appropriate spot, leaving the other stories unchanged. Thus, the amount of reranking is significantly reduced. There is, however, the possibility that a story stops getting votes and ends up stuck in a high position. To avoid this, every 30 seconds one of the top 50 stories is randomly selected and reranked. The consequence is that a story may be "wrongly" ranked for many minutes if it isn't getting votes. In addition, pages can be cached for 90 seconds.

Raw scores and the #1 spot on a typical day

The following image shows the raw scores (excluding penalties) for the top 60 HN articles throughout the day of November 11. Each line corresponds to an article, colored according to its position on the page. The red line shows the top article on HN. Note that because of penalties, the article with the top raw score often isn't the top article.

Hacker News raw article scores throughout a day. Red line indicates the #1 article. Due to penalties, the #1 article does not always have the top score.

This chart shows a few interesting things. The score for an article shoots up rapidly and then slowly drops over many hours. The scoring formula accounts for much of this: an article getting a constant rate of votes will peak quickly and then gradually descend. But the observed peak is even faster - this is because articles tend to get a lot of votes in the first hour or two, and then the voting rate drops off. Combining these two factors yields the steep curves shown.

There are a few articles each day that score much above the rest, along with a lot of articles in the middle. Some articles score very well but are unlucky and get stuck behind a more popular article. Other articles hit #1 briefly, between the fall of one and the climb of another.

Looking at the difference between the article with the top raw score (top of the graph) and the top-ranked article (red line), you can see when penalties have been applied. The article Getting website registration completely wrong hit #1 early in the morning, but was penalized for controversy and rapidly dropped down the page, letting Linux ate my RAM briefly get the #1 spot before Simpsons in CSS overtook it. A bit later, the controversy penalty was applied to Apple Maps shortly after it reached the #1 spot, causing it to lose its #1 spot and rapidly drop down the rankings. The Snapchat article reached the top of HN but was penalized so heavily at 8:22 am that it dropped off the chart entirely. Why you should never use MongoDB was hugely popular and would have spent much of the day in the #1 spot, except it was rapidly penalized and languished around #7. Severing ties with the NSA started off with a NSA penalty but was so hugely popular it still got the #1 spot. However, it was quickly given an even bigger penalty, forcing it down the page. Finally, near the end of the day $4.1m goes missing was penalized. As it turns out, it would have soon lost the #1 spot to FTL even without the penalty.

The green triangles and text show where "controversy" penalties were applied. The blue triangles and text show where articles were penalized into oblivion, dropping off the top 60. Milder penalties are not shown here.

It's clear that the content of the #1 spot on HN isn't "natural", but results from the constant application of penalties to many articles. It's unclear if these penalties result from HN administrators or from flagged articles.

Submissions that get automatically penalized

Some submissions get automatically penalized based on the title, and others get penalized based on the domain. It appears that any article with NSA in the title gets an automatic penalty of .4. I looked for other words causing automatic penalties, such as awesome, bitcoin, and bubble but they do not seem to get penalized. I observed that many websites appear to automatically get a penalty of .25 to .8: arstechnica.com, businessinsider.com, easypost.com, github.com, imgur.com, medium.com, quora.com, qz.com, reddit.com, rt.com, stackexchange.com, theguardian.com, theregister.com, theverge.com, torrentfreak.com, youtube.com. I'm sure the actual list is longer. (This is separate from "banned" sites, which were listed at one point.

One interesting theory by eterm is that news from popular sources gets submitted in parallel by multiple people resulting in more upvotes than the article "merits". Automatically penalizing popular websites would help counteract this effect.

The impact of penalties

Using the scoring formula, the impact of a penalty can be computed. If an article gets a penalty factor of .4, this is equivalent to each vote only counting as .3 votes. Alternatively, the article will drop in ranking 66% faster than normal. A penalty factor of .1 corresponds to each vote counting as .05 votes, or the article dropping at 3.6 times the normal rate. Thus, a penalty factor of .4 has a significant impact, and .1 is very severe.

Controversy In order to prevent flamewars on Hacker News, articles with "too many" comments will get heavily penalized as "controversial". In the published code, the contro-factor function kicks in for any post with more than 20 comments and more comments than upvotes. Such an article is scaled by (votes/comments)^2. However, the actual formula is different - it is active for any post with more comments than upvotes and at least 40 comments. Based on empirical data, I suspect the exponent is 3, rather than 2 but haven't proven this. The controversy penalty can have a sudden and catastrophic effect on an article's ranking, causing an article to be ranked highly one minute and vanish when it hits 40 comments. If you've wondered why a popular article suddenly vanishes from the front page, controversy is a likely cause. For example, Why the Chromebook pundits are out of touch with reality dropped from #5 to #22 the moment it hit 40 comments, and Show HN: Get your health records from any doctor' was at #17 but vanished from the top 60 entirely on hitting 40 comments.

My methodology

I crawled the /news and /news2 pages every minute (staying under the 2 pages per minute guideline). I parsed the (somewhat ugly) HTML with Beautiful Soup, processed the results with a big pile of Python scripts, and graphed results with the incomprehensible but powerful matplotlib. The basic idea behind the analysis is to generate raw scores using the formula and then look for anomalies. At a point in time (e.g. 11/09 8:46), we can compute the raw scores on the top 10 stories:

2.802 Pyret: A new programming language from the creators of Racket
1.407 The Big Data Brain Drain: Why Science is in Trouble
1.649 The NY Times endorsed a secretive trade agreement that the public can't read
0.785 S.F. programmers build alternative to HealthCare.gov (warning: autoplay video)
0.844 Marelle: logic programming for devops
0.738 Sprite Lamp
0.714 Why Teenagers Are Fleeing Facebook
0.659 NodeKnockout is in Full Tilt. Checkout some demos
0.805 ISO 1
0.483 Shopify accepts Bitcoin.
0.452 Show HN: Understand closures
Note that three of the top 10 articles are ranked lower than expected from their score: The NY Times, Marelle and ISO 1. Since The NY Times is ranked between articles with 1.407 and 0.785, its penalty factor can be computed as between .47 and .85. Likewise, the other penalties must be .87 to .93, and .60 to .82. I observed that most stories are ranked according to their score, and the exceptions are consistently ranked much lower, indicating a penalty. This indicates that the scoring formula in use matches the published code. If the formula were different, for instance the gravity exponent were larger, I'd expect to see stories drift out of their "expected" ranking as their votes or age increased, but I never saw this.

This technique shows the existence of a penalty and gives a range for the penalty, but determining the exact penalty is difficult. You can look at the range over time and hope that it converges to a single value. However, several sources of error mess this up. First, the neighboring articles may also have penalties applied, or be scored differently (e.g. job postings). Second, because articles are not constantly reranked, an article may be out of place temporarily. Third, the penalty on an article may change over time. Fourth, the reported vote count may differ from the actual vote count because "bad" votes get suppressed. The result is that I've been able to determine approximate penalties, but there is a fair bit of numerical instability.

Penalties over a day

The following graph shows the calculated penalties over the course of a day. Each line shows a particular article. It should start off at 1 (no penalty), and then drop to a penalty level when a penalty is applied. The line ends when the article drops off the top 60, which can be fairly soon after the penalty is applied. There seem to be penalties of 0.2 and 0.4, as well as a lot in the 0.8-0.9 range. It looks like a lot of penalties are applied at 9am (when moderators arrive?), with more throughout the day. I'm experimenting with different algorithms to improve the graph since it is pretty noisy.
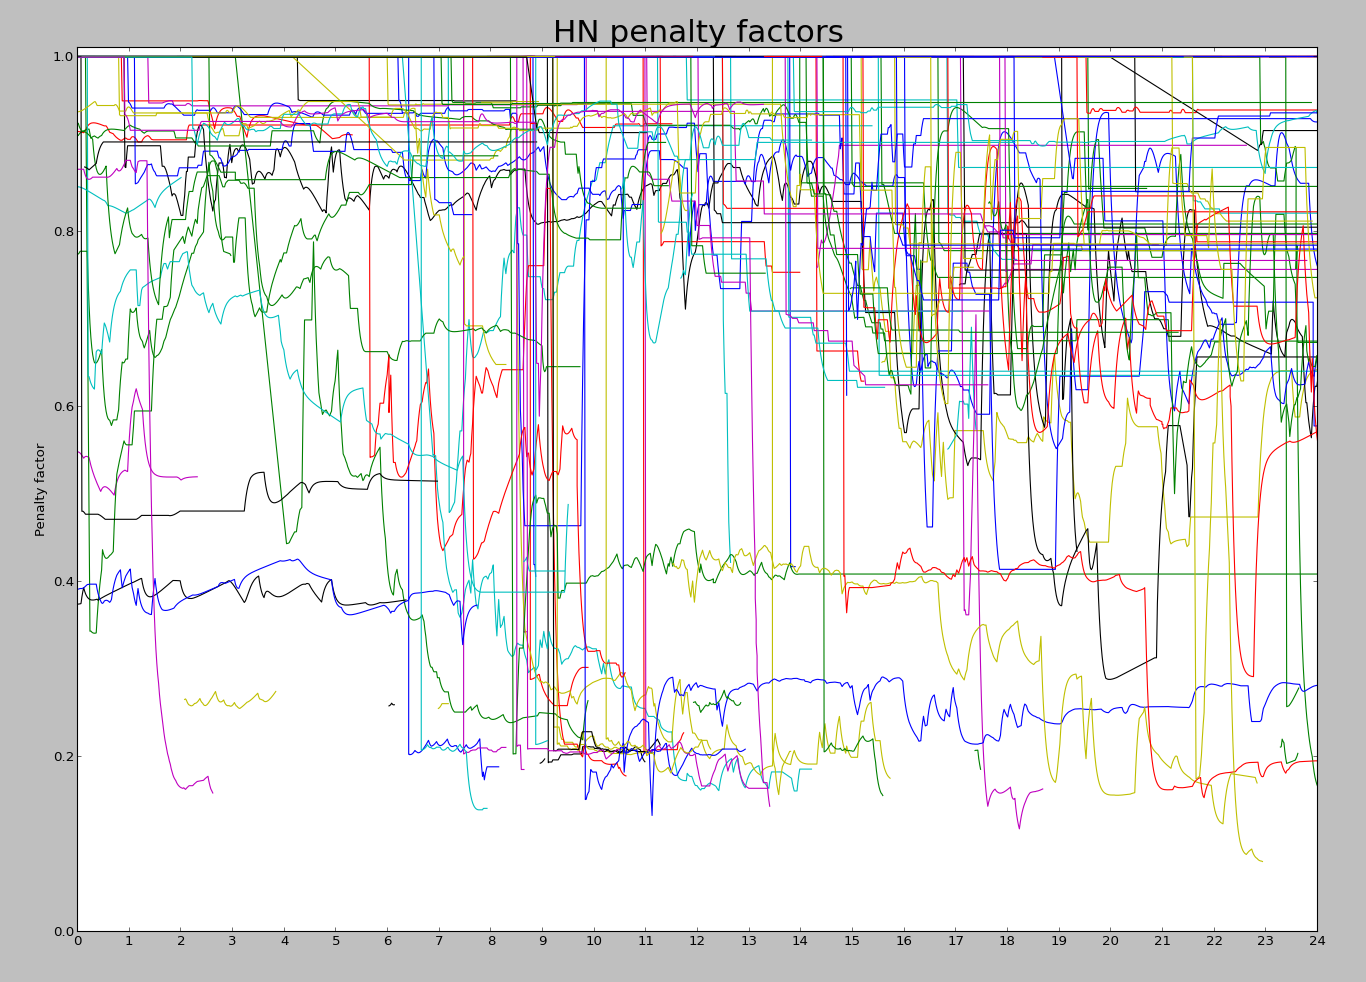
On average, about 20% of the articles on the front page have been penalized, while 38% of the articles on the second page have been penalized. (The front page rate is lower since penalized articles are less likely to be on the front page, kind of by definition.) There is a lot more penalization going on than you might expect.

Here's a list of the articles on the front page on 11/11 that were penalized. (This excludes articles that would have been there if they weren't penalized.) This list is much longer than I expected; scroll for the full list.

Why the Climate Corporation Sold Itself to Monsanto, Facebook Publications, Bill Gates: What I Learned in the Fight Against Polio, McCain says NSA chief Keith Alexander 'should resign or be fired', You are not a software engineer, What is a y-combinator?, Typhoon Haiyan kills 10,000 in Philippines, To Persuade People, Tell Them a Story, Tetris and The Power Of CSS, Microsoft Research Publications, Moscow subway sells free tickets for 30 sit-ups, The secret world of cargo ships, These weeks in Rust, Empty-Stomach Intelligence, Getting website registration completely wrong, The Six Most Common Species Of Code, Amazon to Begin Sunday Deliveries, With Post Office's Help, Linux ate my RAM, Simpsons in CSS, Apple maps: how Google lost when everyone thought it had won, Docker and Go: why did we decide to write Docker in Go?, Amazon Code Ninjas, Last Doolittle Raiders make final toast, Linux Voice - A new Linux magazine that gives back, Want to download anime? Just made a program for that, Commit 15 minutes to explain to a stranger why you love your job., Why You Should Never Use MongoDB, Show HN: SketchDeck - build slides faster, Zero to Peanut Butter Docker Time in 78 Seconds, NSA's Surveillance Powers Extend Far Beyond Counterterrorism, How Sentry's Open Source Service Was Born, Real World OCaml, Show HN: Get your health records from any doctor, Why the Chromebook pundits are out of touch with reality, Towards a More Modular Future for JavaScript Libraries, Why is virt-builder written in OCaml?, IOS: End of an Era, The craziest things you can plug into your iPhone's audio jack, RFC: Replace Java with Go in default languages, Show HN: Find your health plan on Health Sherpa, Web Latency Benchmark: A new kind of browser benchmark, Why are Amazon, Facebook and Yahoo copying Microsoft's stack ranking system?, Severing Ties with the NSA, Doctor performs surgery using Google Glass, Duplicity + S3: Easy, cheap, encrypted, automated full-disk backups, Bitcoin's UK future looks bleak, Amazon Redshift's New Features, You're only getting the nice feedback, Software is Easy, Hardware is of Medium Difficulty, Facebook Warns Users After Adobe Breach, International Space Station Infected With USB Stick Malware, Tidbit: Client-Side Bitcoin Mining, Go: "I have already used the name for *MY* programming language", Multi-Modal Drone: Fly, Swim & Drive, The Daily Go Programming Newspaper, "We have no food, we need water and other things to survive.", Introducing the Humble Store, The Six Most Common Species Of Code, $4.1m goes missing as Chinese bitcoin trading platform GBL vanishes, Could Bitcoin Be More Disruptive than the Internet?, Apple Store is updating.

The code for the scoring formula

The Arc source code for a version of the HN server is available, as well as an updated scoring formula:
  (= gravity* 1.8 timebase* 120 front-threshold* 1
       nourl-factor* .4 lightweight-factor* .17 gag-factor* .1)

    (def frontpage-rank (s (o scorefn realscore) (o gravity gravity*))
      (* (/ (let base (- (scorefn s) 1)
              (if (> base 0) (expt base .8) base))
            (expt (/ (+ (item-age s) timebase*) 60) gravity))
         (if (no (in s!type 'story 'poll))  .8
             (blank s!url)                  nourl-factor*
             (mem 'bury s!keys)             .001
                                            (* (contro-factor s)
                                               (if (mem 'gag s!keys)
                                                    gag-factor*
                                                   (lightweight s)
                                                    lightweight-factor*
                                                   1)))))
In case you don't read Arc code, the above snippet defines several constants: gravity* = 1.8, timebase* = 120 (minutes), etc. It then defines a method frontpage-rank that ranks a story s based on its upvotes (realscore) and age in minutes (item-age). The penalty factor is defined by an if with several cases. If the article is not a 'story' or 'poll', the penalty factor is .8. Otherwise, if the URL field is blank (Ask HN, etc.) the factor is nourl-factor*. If the story has been flagged as 'bury', the scale factor is 0.001 and the article is ranked into oblivion. Finally, the default case combines the controversy factor and the gag/lightweight factor. The controversy factor contro-factor is intended to suppress articles that are leading to flamewars, and is discussed more later.

The next factor hits an article flagged as a gag (joke) with a heavy value of .1, and a "lightweight" article with a factor of .17. The actual penalty system appears to be much more complex than what appears in the published code.

Conclusion

An article's position on the Hacker News home page isn't the meritocracy based on upvotes that you might expect. By carefully examining the articles that appear on the Hacker News page, we can learn a great deal about the scoring formula in use. While upvotes are the obvious factor controlling rankings, there is also a complex "penalty" system causing articles to be ranked lower or disappear entirely. This isn't just preventing spam, but affects many very popular articles. And if an article has more comments than votes, don't add your comment to it or you may kill it off entirely! See discussion on Hacker News.


Update (11/18): article on penalties is penalized

Ironically, this article was penalized on Hacker News. Minutes after reaching the front page, a heavy 0.2 penalty was applied to the article, forcing it off the front page. The black line in the graph below shows the position of this article on Hacker News. You can see the sharp drop when the penalty was applied. The gray line shows where the article would have been ranked without the penalty. Without the penalty, the article would have been in the #5 spot, but with the penalty it never made it back onto the front page (positions 1-30). The lower green line shows the raw score of this article. (11/26: I'm told that the penalty was because the "voting ring detection" triggered erroneously.)
This article was penalized shortly after reaching the front page of Hacker News

The Mathematics of Volleyball

Recently I was at a multi-day volleyball tournament, which gave me plenty of time to ponder the mathematics of the game. At different points in the game, I'd wonder what the odds were of each team winning. And when a team gained or lost a point, I'd wonder how important that point was. Clearly, if the score was 24-24, gaining a point made a huge difference. But how much difference did getting one point at the beginning of the game matter? It seemed like it didn't matter much, but did it?

I decided to analyze the game mathematically. I made the simplifying assumption that each team had 50-50 odds of winning each point. I found the analysis interesting, and it turns out to have close ties to Pascal's Triangle, so I'm posting it here in case anyone else is interested.

Volleyball games are scored using the rally point system, which means that one team gets a point on every serve. (Back in the olden days, volleyball used side-out scoring, which meant that only the serving team could get a point. Fortunately, rally point scoring is more mathematically tractable. Rally point scoring also keeps the game advancing faster.) The winner of each match is the best out of three sets (a set is the same as a game). In the league I was watching, the winner of a game is the first team to get 25 points and be ahead by at least 2. (Except if a third tiebreaker game is needed, it only goes to 15 points instead of 25.)

A few cases are easy to analyze mathematically. If we assume each team has a 50-50 chance of scoring each point and the score is tied, each team obviously has a 50% chance of winning the game. (With side-out scoring, it makes a difference which team is serving, but for rally point scoring we avoid that complication.) The second obvious case is if a team has 25 points and the other team has 23 or fewer points, the first team has 100% chance of winning (since they already won).

I will use the notation P(m,n) for the chance of the first team wining if the score is m to n. From above, P(n, n) = 50%, P(25, n) = 100% for n <= 23, and P(m, 25) = 0% for m <= 23.

The chance of winning in other cases can be calculated from the assumption that a team has a 50% chance of winning the point, and a 50% chance of losing: the chance of winning is the average of these two circumstances. Mathematically, we get the simple recurrence:

For instance, if the score is 25-24, if the first team scores, they win. If the second team scores, then the score is tied. In the first (winning) case, the first team wins 100%, and in the second (tied) case, the first team wins 50%. Thus, on average they will win 75% of the time from a 25-24 lead. That is, P(25, 24) = 75%, and by symmetry P(24, 25) = 25%. (Surprisingly, these are the only scores where the requirement to win by 2 points changes the odds.)

Likewise, if the score is 24-23, half the time the first team will score a point and win, and half the time the second team will score a point and tie. So the first team has 1/2 * 100% + 1/2 * 50% = 75% chance of winning, and P(24, 23) = 75%.

More interesting is if the score is 24-22, half the time the first team will score a point and win, and half the time the second team will score, making the score 24-23. We know from above that the first team has a 75% chance of winning from 24-23, so P(24, 22) = 1/2 * 100% + 1/2 * 75% = 87.5%.

We can use the recurrence to work backwards and find the probability of winning from any score. The following table shows the probability of winning for each score. The first team has the score on the left, and the second team has the score on the top.

Table with odds of winning when the score is m to n

012345678910111213141516171819202122232425
050%44%39%33%28%23%18%14%11%8%5%4%2%1%1%0%0%0%0%0%0%0%0%0%0%0%
156%50%44%38%33%27%22%17%13%10%7%5%3%2%1%1%0%0%0%0%0%0%0%0%0%0%
261%56%50%44%38%32%27%21%17%13%9%7%4%3%2%1%1%0%0%0%0%0%0%0%0%0%
367%62%56%50%44%38%32%26%21%16%12%9%6%4%3%1%1%0%0%0%0%0%0%0%0%0%
472%67%62%56%50%44%37%31%26%20%16%11%8%6%4%2%1%1%0%0%0%0%0%0%0%0%
577%73%68%62%56%50%44%37%31%25%20%15%11%7%5%3%2%1%0%0%0%0%0%0%0%0%
682%78%73%68%63%56%50%43%37%30%24%19%14%10%7%4%3%1%1%0%0%0%0%0%0%0%
786%83%79%74%69%63%57%50%43%36%30%24%18%13%9%6%4%2%1%1%0%0%0%0%0%0%
889%87%83%79%74%69%63%57%50%43%36%29%23%17%12%8%5%3%2%1%0%0%0%0%0%0%
992%90%87%84%80%75%70%64%57%50%43%36%29%22%16%11%8%5%3%1%1%0%0%0%0%0%
1095%93%91%88%84%80%76%70%64%57%50%43%35%28%21%15%11%7%4%2%1%0%0%0%0%0%
1196%95%93%91%89%85%81%76%71%64%57%50%42%35%27%20%14%9%6%3%2%1%0%0%0%0%
1298%97%96%94%92%89%86%82%77%71%65%58%50%42%34%26%19%13%8%5%2%1%0%0%0%0%
1399%98%97%96%94%93%90%87%83%78%72%65%58%50%42%33%25%18%12%7%4%2%1%0%0%0%
1499%99%98%97%96%95%93%91%88%84%79%73%66%58%50%41%32%24%17%11%6%3%1%0%0%0%
15100%99%99%99%98%97%96%94%92%89%85%80%74%67%59%50%41%31%23%15%9%5%2%1%0%0%
16100%100%99%99%99%98%97%96%95%92%89%86%81%75%68%59%50%40%30%21%13%7%3%1%0%0%
17100%100%100%100%99%99%99%98%97%95%93%91%87%82%76%69%60%50%40%29%19%11%5%2%0%0%
18100%100%100%100%100%100%99%99%98%97%96%94%92%88%83%77%70%60%50%39%27%17%9%4%1%0%
19100%100%100%100%100%100%100%99%99%99%98%97%95%93%89%85%79%71%61%50%38%25%14%6%2%0%
20100%100%100%100%100%100%100%100%100%99%99%98%98%96%94%91%87%81%73%62%50%36%23%11%3%0%
21100%100%100%100%100%100%100%100%100%100%100%99%99%98%97%95%93%89%83%75%64%50%34%19%6%0%
22100%100%100%100%100%100%100%100%100%100%100%100%100%99%99%98%97%95%91%86%77%66%50%31%12%0%
23100%100%100%100%100%100%100%100%100%100%100%100%100%100%100%99%99%98%96%94%89%81%69%50%25%0%
24100%100%100%100%100%100%100%100%100%100%100%100%100%100%100%100%100%100%99%98%97%94%88%75%50%25%
25100%100%100%100%100%100%100%100%100%100%100%100%100%100%100%100%100%100%100%100%100%100%100%100%75%50%

Any particular chance of winning can be easily read from the table. For instance, if the score is 15-7, look where row 15 and column 7 meet, and you'll find that the first team has a 94% chance of winning. (This is P(15, 7) in my notation.)

The table illustrates several interesting characteristics of scores. The odds fall away from 50% pretty rapidly as you move away from the diagonal (i.e. away from a tied score). Points matter a lot more near the end of the game, though: you've only got a 1% chance of winning from an 18-24 position, while being six points behind at the beginning (0-6) still gives you an 18% chance of winning. However, a big deficit is almost insurmountable - if you're behind 0-15, you have less than a 1% chance of catching up and winning. (Note that 0% and 100% in the table are not exactly 0% and 100%, because there's always some chance to win or lose.)

Note that each score is the average of the score below and the score to the right - these are the cases where the first team gets the point and the second team gets the point. This corresponds directly to the equation above.

The table could be extended arbitrarily far if neither team gets a two point lead, but those cases are not particularly interesting.

Generating the score table with dynamic programming

To generate the table, I wrote a simple Arc program to solve the recurrence equation using dynamic programming:
(def scorePercent (s1 s2 max)
  (if (and (>= s1 max) (>= s1 (+ s2 2))) 100.
      (and (>= s2 max) (>= s2 (+ s1 2))) 0
      (is s1 s2) 50.
      (/ (+ (scorePercent s1 (+ s2 1) max)
            (scorePercent (+ s1 1) s2 max)) 2)))
The first two arguments are the current score, and the last argument is the amount to win (25 in this case). For instance:
arc> (scorePercent 24 22 25)
87.5
arc> (scorePercent 20 22 25)
22.65625
Unfortunately, the straightforward way of solving the problem has a severe performance problem. For instance, computing (scorePercent 5 7 25) takes hours and hours. The problem is that evaluating P(5, 7) requires calculating two cases: P(6, 7) and P(5, 8). Each of those requires two cases, each of which requires two cases, and so on. The result is an exponential number of evaluations, which takes a very very long time as the scores get lower. Most of these evaluations calculate the same values over and over, which is just wasted work. For instance, P(6, 8) is computed in order to compute P(6, 7) and P(6, 8) is computed again in order to compute P(5, 8).

There are a couple ways to improve performance. The hard way of solving the dynamic programming problem without this exponential blowup is to carefully determine an order in which each value can be calculated exactly once by working backwards, until you end up with the desired value. For instance, if the values are calculated going up the columns from right to left, each value can be computed immediately from two values that have already been computed, until we end up efficiently computing the whole table in approximately 25*25 steps. This requires careful coding to step through the table in the right order and to save each result as it is calculated. It's not too hard, but there's a much easier way.

The easy way of solving the problem is with memoization - when an intermediate value is calculated, remember its value in case you need it again, instead of calculating it over and over. With memoization, we can compute the results in any order we want, and automatically each result will only be computed once.

In Arc, memoization can be implemented simply by defining a function with defmemo, which will automatically memoize the results of the function evaluation:

(defmemo scorePercent (s1 s2 max)
  (if (and (>= s1 max) (>= s1 (+ s2 2))) 100.
      (and (>= s2 max) (>= s2 (+ s1 2))) 0
      (is s1 s2) 50.
      (/ (+ (scorePercent s1 (+ s2 1) max)
            (scorePercent (+ s1 1) s2 max)) 2)))
With this simple change, results are nearly instantaneous, rather than taking hours.

The above function generates a single entry in the table. To generate the full table in HTML with colored cells, I used a simple loop and Arc's HTML generating operations. If you're interested in Arc programming, the full code can be downloaded here.

Mathematical analysis

Instead of computing the probabilities through dynamic programming, it is possible to come up with a mathematical solution. After studying the values for a while, I realized rather surprisingly that the probabilities are closely tied to Pascal's Triangle. You may be familiar with Pascal's Triangle, where each element is the sum of the two elements above it (with 1's along the edges), forming a table of binomial coefficients:

Pascal's Triangle

Pascal's triangle

The game probabilities come from the triangle of partial sums of binomial coefficients, which is a lesser-known sequence that is easily derived from Pascal's Triangle. This sequence, T(n, k) is formed by summing the first k elements in the corresponding row of Pascal's Triangle. That is, the first element is the first element in the same row of Pascal's triangle, the second is the sum of the first two elements in Pascal's triangle, the third is the sum of the first three, etc.

T - the partial row sums of Pascal's Triangle

Partial row sums in Pascal's triangle
Mathematically, this triangle T(n, k) is defined by:


As with Pascal's Triangle, each element is the sum of the two above it, but now the right-hand border is powers of 2. This triangle is discussed in detail in the Online Encyclopedia of Integer Sequences. Surprisingly, this triangle is closely connected with distances in a hypercube, error-correcting codes, and how many pieces an n-dimensional cake can be cut into.

With function T defined above, the volleyball winning probabilities are given simply by:

For example, P(23,20) = T(6, 4)/2^6 = 89.0625%, which matches the table.

Intuitively, it makes sense that the probabilities are related to Pascal's Triangle, because each entry in Pascal's Triangle is the sum of the two values above, while each probability entry is the average of the value above and the value to the right in the table. Because taking the average divides by 2 in each step, an exponent of 2 appears in the denominator. The equation can be proved straightfowardly by induction.

The importance of a point

Suppose the score is m to n. How important is the next point? I'll consider the importance of the point to be how much more likely the team is to win the game if they win the point versus losing the point. For instance, suppose the score is 18-12, so the first team has a 92% chance of winning (from the previous table). If they win the next point, their chance goes up to 95%, while if they lose the point, their chance drops to 88%. Thus, we'll consider the importance to be 7%. Mathematically, if the score is m to n, I define the importance as P(m+1, n) - P(m, n+1).

Table with importance of the next point when the score is m to n

012345678910111213141516171819202122232425
011%11%11%11%10%9%8%7%6%5%4%3%2%1%1%0%0%0%0%0%0%0%0%0%0%0%
111%12%12%11%11%10%9%8%7%6%4%3%2%2%1%1%0%0%0%0%0%0%0%0%0%0%
211%12%12%12%12%11%10%9%8%7%6%4%3%2%2%1%1%0%0%0%0%0%0%0%0%0%
311%11%12%12%12%12%11%10%9%8%7%5%4%3%2%1%1%0%0%0%0%0%0%0%0%0%
410%11%12%12%13%13%12%12%11%9%8%7%5%4%3%2%1%1%0%0%0%0%0%0%0%0%
59%10%11%12%13%13%13%13%12%11%10%8%7%5%4%3%2%1%1%0%0%0%0%0%0%0%
68%9%10%11%12%13%13%13%13%12%11%10%8%6%5%3%2%1%1%0%0%0%0%0%0%0%
77%8%9%10%12%13%13%14%14%13%12%11%10%8%6%5%3%2%1%1%0%0%0%0%0%0%
86%7%8%9%11%12%13%14%14%14%14%13%11%10%8%6%4%3%2%1%0%0%0%0%0%0%
95%6%7%8%9%11%12%13%14%14%14%14%13%12%10%8%6%4%3%1%1%0%0%0%0%0%
104%4%6%7%8%10%11%12%14%14%15%15%14%13%12%10%8%6%4%2%1%1%0%0%0%0%
113%3%4%5%7%8%10%11%13%14%15%15%15%15%14%12%10%7%5%3%2%1%0%0%0%0%
122%2%3%4%5%7%8%10%11%13%14%15%16%16%15%14%12%10%7%5%3%1%1%0%0%0%
131%2%2%3%4%5%6%8%10%12%13%15%16%17%17%16%14%12%9%7%4%2%1%0%0%0%
141%1%2%2%3%4%5%6%8%10%12%14%15%17%18%18%17%15%12%9%6%3%2%1%0%0%
150%1%1%1%2%3%3%5%6%8%10%12%14%16%18%19%19%17%15%12%9%5%3%1%0%0%
160%0%1%1%1%2%2%3%4%6%8%10%12%14%17%19%20%20%18%16%12%8%4%2%0%0%
170%0%0%0%1%1%1%2%3%4%6%7%10%12%15%17%20%21%21%19%16%12%7%3%1%0%
180%0%0%0%0%1%1%1%2%3%4%5%7%9%12%15%18%21%23%23%21%16%11%5%2%0%
190%0%0%0%0%0%0%1%1%1%2%3%5%7%9%12%16%19%23%25%25%22%16%9%3%0%
200%0%0%0%0%0%0%0%0%1%1%2%3%4%6%9%12%16%21%25%27%27%23%16%6%0%
210%0%0%0%0%0%0%0%0%0%1%1%1%2%3%5%8%12%16%22%27%31%31%25%12%0%
220%0%0%0%0%0%0%0%0%0%0%0%1%1%2%3%4%7%11%16%23%31%38%38%25%0%
230%0%0%0%0%0%0%0%0%0%0%0%0%0%1%1%2%3%5%9%16%25%38%50%50%25%
240%0%0%0%0%0%0%0%0%0%0%0%0%0%0%0%0%1%2%3%6%12%25%50%50%50%
250%0%0%0%0%0%0%0%0%0%0%0%0%0%0%0%0%0%0%0%0%0%0%25%50%50%

The values in the table make intuitive sense. If one team is winning by a lot, one more point doesn't make much difference. But if the scores are close, then each point counts. Each point counts a lot more near the end of the game than at the beginning. The first point only makes an 11% difference in the odds of winning, while the if the score is 23-23, the point makes a 50% difference (75% chance of winning if you get the point vs 25% if you miss the point). This table is sort of a derivative of the first table, showing where the values are changing most rapidly.

The importance of a point as defined above closely matches the behavior of the spectators. If the score is very close at the end of the game, the audience becomes much more animated compared to earlier in the game.

The "importance" is mathematically simpler than the probability of winning derived earlier. If the current score is 25-a, 25-b, then the importance is given by the simple equation:

This can proved straighforwardly from the equation for P(x, y). For example, if the score is 18-12, the importance is C(7+13-2, 6) / 2^(7+13-2) = 18564 / 262144 = 7.08%.

Conclusions

How useful is this model? Well, it depends on the assumption that each team has an equal chance of winning each point. Of course, most teams are not evenly matched. Even more important is the fact that if a team has a good server, they can quickly rack up 10 points in a row, which throws the model out the window.

However, I think the model is still useful, since it provides some quantitative answers to the original questions, and confirms some intuitions. In addition, the mathematics turned out to be more interesting than I was expecting, with the surprising connection to Pascal's Triangle.

Python version

P.S. The code above is in Arc, an obscure language. Here's a version of the code in Python that will be more useful:
solved = {} # Remember values that have been solved

# Compute probability of team 1 wining when score is s1 to s2.
# Max is the points needed to win (typically 25)
# This routine is just a wrapper around scorePercentInt to
# remember values that have been computed.
def scorePercent(s1, s2, max):
  if (s1, s2, max) not in solved:
    solved[s1, s2, max] = scorePercentInt(s1, s2, max)
  return solved[s1, s2, max]

# This routine does the actual calculation
def scorePercentInt(s1, s2, max):
  if s1 >= max and s1 >= s2 + 2: return 100
  if s2 >= max and s2 >= s1 + 2: return 0
  if s1 == s2: return 50
  return (scorePercent(s1, s2+1, max) + scorePercent(s1+1, s2, max)) / 2.

for i in range(0, 26):
  for j in range(0, 26):
    print '%.3f' % scorePercent(i, j, 25),
  print

IPv6 web serving with Arc or Python: adventures in IPv6

Lego Minifig on a Sheevaplug running IPv6 I've been experimenting with IPv6 on my home network. In part 1, I described how I set up an IPv6 tunnel on Windows 7 and how IPv6 killed my computer. Now, I will describe how I set up a simple (i.e. trivial) IPv6 web server using Arc or Python, on Windows or Linux, which can be accessed at http://ipv6.nlanguages.com.

My IPv6 explorations are roughly driven by Hurricane Electric's IPv6 Certification levels. To get from "Newbie" to "Enthusiast" you have to have an IPv6 web server. I expected I could just use the web server you're viewing right now (provided through Pair), but Pair (like most web providers) doesn't support IPv6. So I figured I'd just set up my own simple web server.

To make things more interesting, I decided to set up the server on my Sheevaplug, a very small plug-based computer running Linux. (See my previous articles about Arc on the Sheevaplug, and Arduino with the Sheevaplug.) The things I describe will work just as well on a standard Linux or Windows box, though.

Setting up the SixXS IPv6 tunnel on the Sheevaplug was much easier than setting it up on Windows; I just followed the directions. One gotcha: if your clock is wrong, aiccu will silently fail - check /var/log/syslog.

IPv6 with the Python web server

Python comes with a simple web server. It is easy to configure the web server for IPv6 once you know how, but it took some effort to figure out how to do it.
import socket
from BaseHTTPServer import HTTPServer
from SimpleHTTPServer import SimpleHTTPRequestHandler

class MyHandler(SimpleHTTPRequestHandler):
  def do_GET(self):
    if self.path == '/ip':
      self.send_response(200)
      self.send_header('Content-type', 'text/html')
      self.end_headers()
      self.wfile.write('Your IP address is %s' % self.client_address[0])
      return
    else:
      return SimpleHTTPRequestHandler.do_GET(self)

class HTTPServerV6(HTTPServer):
  address_family = socket.AF_INET6

def main():
  server = HTTPServerV6(('::', 80), MyHandler)
  server.serve_forever()

if __name__ == '__main__':
  main()
Most of this code is standard Python SimpleHTTPServer code. It implements a handler for the path /ip, which returns the client's IP address. For other paths, SimpleHTTPRequestHandler returns a file from the current directory; this is not particulary secure, but works for a demonstration.

The key change to support IPv6 is subclassing HTTPServer and setting the address_family to IPv6. The other key change is starting the server with the name '::', which is the IPv6 equivalent of '', and binds to no specific address. Similar changes work with related Python classes such as SocketServer.

IPv6 with Arc's web server

My next adventure was to run Arc's web server (which I've documented here) on IPv6. Much to my surprise, Arc's web server worked on Windows with IPv6 without any trouble. You don't have to do anything different to serve on IPv6 and the code and logs handle IPv6 addresses as you'd expect. (Most of the credit for this should go to MzScheme/Racket, which provides the underlying socket implementation.)

I simply start a server thread on port 80, and then define a simple web operation on the home page (represented as || for obscure reasons).

arc> (thread (serve 80))
arc> (defop || req (pr "Welcome to Arc!  Your IP is " (req 'ip)))
Accessing this home page displays a message and the IP address of the client (IPv4 or IPv6 as appropriate).

Unfortunately, when I tried running the same Arc code on the Sheevaplug or another Linux box, it refused to work at all with IPv6. The problem turned out to be misconfiguration in the compilation of Racket (the new name for mzscheme). To get IPv6 working, you can recompile Racket following the instructions here. After recompiling, I was able to get Arc working on my Sheevaplug with IPv6. Eventually this fix will get into the official builds.

Note that implementing web pages in Arc requires much less boilerplate than in Python. This isn't too surprising, given that the primary application of Arc is web serving.

Putting the server's IPv6 address into DNS

Once you have an IPv6 web server, how do you access it? You can access a server with a raw IPv6 address: http://[2001:1938:81:1f8::2]/mypage. (Note that the IPv6 address is enclosed in square brackets, unlike a regular IP address.) However, you'll almost certainly want to access your IPv6 server through a domain name in DNS. To do this, you need to create an AAAA record in your domain zone file.

I had the domain name nlanguages.com available, and wanted to point it at my IPv6 web server. To do this, I went to the DNS Zone File Editor for my nameserver (godaddy.com in my case). I created one AAAA entry for host @ to point to my IPv6 address, and a second AAAA entry for host ipv6 to point to my IPv6 address. The @ provides an entry for my top-level domain (nlanguages.com), and the second provides an entry for ipv6.nlanguages.com. I then tested the DNS entries with a nslookup query, asking for the AAAA record: nslookup -q=aaaa nlanguages.com

The result is that http://ipv6.nlanguages.com will access my IPv6 server (if you have IPv6 access.)

Conclusion

Running a simple IPv6 web server in Python or Arc is straightforward, at least if you don't run into a problem with the underlying language implementation. Python requires just a couple additional lines to support IPv6, while Arc supports IPv6 automatically. Thus, you can easily set up an IPv6 web server, just in time for World IPv6 Day.