Recently I was at a multi-day volleyball tournament, which gave me plenty of time to ponder the mathematics of the game. At different points in the game, I'd wonder what the odds were of each team winning. And when a team gained or lost a point, I'd wonder how important that point was. Clearly, if the score was 24-24, gaining a point made a huge difference. But how much difference did getting one point at the beginning of the game matter? It seemed like it didn't matter much, but did it?
I decided to analyze the game mathematically. I made the simplifying assumption that each team had 50-50 odds of winning each point. I found the analysis interesting, and it turns out to have close ties to Pascal's Triangle, so I'm posting it here in case anyone else is interested.
Volleyball games are scored using the rally point system, which means that one team gets a point on every serve. (Back in the olden days, volleyball used side-out scoring, which meant that only the serving team could get a point. Fortunately, rally point scoring is more mathematically tractable. Rally point scoring also keeps the game advancing faster.) The winner of each match is the best out of three sets (a set is the same as a game). In the league I was watching, the winner of a game is the first team to get 25 points and be ahead by at least 2. (Except if a third tiebreaker game is needed, it only goes to 15 points instead of 25.)
A few cases are easy to analyze mathematically. If we assume each team has a 50-50 chance of scoring each point and the score is tied, each team obviously has a 50% chance of winning the game. (With side-out scoring, it makes a difference which team is serving, but for rally point scoring we avoid that complication.) The second obvious case is if a team has 25 points and the other team has 23 or fewer points, the first team has 100% chance of winning (since they already won).
I will use the notation P(m,n) for the chance of the first team wining if the score is m to n. From above, P(n, n) = 50%, P(25, n) = 100% for n <= 23, and P(m, 25) = 0% for m <= 23.
The chance of winning in other cases can be calculated from the assumption that a team has a 50% chance of winning the point, and a 50% chance of losing: the chance of winning is the average of these two circumstances. Mathematically, we get the simple recurrence:
&space;=&space;\frac{P(m+1,n)&space;+&space;P(m,n+1)}{2})
For instance, if the score is 25-24, if the first team scores, they win. If the second team scores, then the score is tied. In the first (winning) case, the first team wins 100%, and in the second (tied) case, the first team wins 50%. Thus, on average they will win 75% of the time from a 25-24 lead. That is, P(25, 24) = 75%, and by symmetry P(24, 25) = 25%. (Surprisingly, these are the only scores where the requirement to win by 2 points changes the odds.)
Likewise, if the score is 24-23, half the time the first team will score a point and win, and half the time the second team will score a point and tie. So the first team has 1/2 * 100% + 1/2 * 50% = 75% chance of winning, and P(24, 23) = 75%.
More interesting is if the score is 24-22, half the time the first team will score a point and win, and half the time the second team will score, making the score 24-23. We know from above that the first team has a 75% chance of winning from 24-23, so P(24, 22) = 1/2 * 100% + 1/2 * 75% = 87.5%.
We can use the recurrence to work backwards and find the probability of winning from any score. The following table shows the probability of winning for each score. The first team has the score on the left, and the second team has the score on the top.
Table with odds of winning when the score is m to n
| 0 | 1 | 2 | 3 | 4 | 5 | 6 | 7 | 8 | 9 | 10 | 11 | 12 | 13 | 14 | 15 | 16 | 17 | 18 | 19 | 20 | 21 | 22 | 23 | 24 | 25 |
|---|
| 0 | 50% | 44% | 39% | 33% | 28% | 23% | 18% | 14% | 11% | 8% | 5% | 4% | 2% | 1% | 1% | 0% | 0% | 0% | 0% | 0% | 0% | 0% | 0% | 0% | 0% | 0% |
|---|
| 1 | 56% | 50% | 44% | 38% | 33% | 27% | 22% | 17% | 13% | 10% | 7% | 5% | 3% | 2% | 1% | 1% | 0% | 0% | 0% | 0% | 0% | 0% | 0% | 0% | 0% | 0% |
|---|
| 2 | 61% | 56% | 50% | 44% | 38% | 32% | 27% | 21% | 17% | 13% | 9% | 7% | 4% | 3% | 2% | 1% | 1% | 0% | 0% | 0% | 0% | 0% | 0% | 0% | 0% | 0% |
|---|
| 3 | 67% | 62% | 56% | 50% | 44% | 38% | 32% | 26% | 21% | 16% | 12% | 9% | 6% | 4% | 3% | 1% | 1% | 0% | 0% | 0% | 0% | 0% | 0% | 0% | 0% | 0% |
|---|
| 4 | 72% | 67% | 62% | 56% | 50% | 44% | 37% | 31% | 26% | 20% | 16% | 11% | 8% | 6% | 4% | 2% | 1% | 1% | 0% | 0% | 0% | 0% | 0% | 0% | 0% | 0% |
|---|
| 5 | 77% | 73% | 68% | 62% | 56% | 50% | 44% | 37% | 31% | 25% | 20% | 15% | 11% | 7% | 5% | 3% | 2% | 1% | 0% | 0% | 0% | 0% | 0% | 0% | 0% | 0% |
|---|
| 6 | 82% | 78% | 73% | 68% | 63% | 56% | 50% | 43% | 37% | 30% | 24% | 19% | 14% | 10% | 7% | 4% | 3% | 1% | 1% | 0% | 0% | 0% | 0% | 0% | 0% | 0% |
|---|
| 7 | 86% | 83% | 79% | 74% | 69% | 63% | 57% | 50% | 43% | 36% | 30% | 24% | 18% | 13% | 9% | 6% | 4% | 2% | 1% | 1% | 0% | 0% | 0% | 0% | 0% | 0% |
|---|
| 8 | 89% | 87% | 83% | 79% | 74% | 69% | 63% | 57% | 50% | 43% | 36% | 29% | 23% | 17% | 12% | 8% | 5% | 3% | 2% | 1% | 0% | 0% | 0% | 0% | 0% | 0% |
|---|
| 9 | 92% | 90% | 87% | 84% | 80% | 75% | 70% | 64% | 57% | 50% | 43% | 36% | 29% | 22% | 16% | 11% | 8% | 5% | 3% | 1% | 1% | 0% | 0% | 0% | 0% | 0% |
|---|
| 10 | 95% | 93% | 91% | 88% | 84% | 80% | 76% | 70% | 64% | 57% | 50% | 43% | 35% | 28% | 21% | 15% | 11% | 7% | 4% | 2% | 1% | 0% | 0% | 0% | 0% | 0% |
|---|
| 11 | 96% | 95% | 93% | 91% | 89% | 85% | 81% | 76% | 71% | 64% | 57% | 50% | 42% | 35% | 27% | 20% | 14% | 9% | 6% | 3% | 2% | 1% | 0% | 0% | 0% | 0% |
|---|
| 12 | 98% | 97% | 96% | 94% | 92% | 89% | 86% | 82% | 77% | 71% | 65% | 58% | 50% | 42% | 34% | 26% | 19% | 13% | 8% | 5% | 2% | 1% | 0% | 0% | 0% | 0% |
|---|
| 13 | 99% | 98% | 97% | 96% | 94% | 93% | 90% | 87% | 83% | 78% | 72% | 65% | 58% | 50% | 42% | 33% | 25% | 18% | 12% | 7% | 4% | 2% | 1% | 0% | 0% | 0% |
|---|
| 14 | 99% | 99% | 98% | 97% | 96% | 95% | 93% | 91% | 88% | 84% | 79% | 73% | 66% | 58% | 50% | 41% | 32% | 24% | 17% | 11% | 6% | 3% | 1% | 0% | 0% | 0% |
|---|
| 15 | 100% | 99% | 99% | 99% | 98% | 97% | 96% | 94% | 92% | 89% | 85% | 80% | 74% | 67% | 59% | 50% | 41% | 31% | 23% | 15% | 9% | 5% | 2% | 1% | 0% | 0% |
|---|
| 16 | 100% | 100% | 99% | 99% | 99% | 98% | 97% | 96% | 95% | 92% | 89% | 86% | 81% | 75% | 68% | 59% | 50% | 40% | 30% | 21% | 13% | 7% | 3% | 1% | 0% | 0% |
|---|
| 17 | 100% | 100% | 100% | 100% | 99% | 99% | 99% | 98% | 97% | 95% | 93% | 91% | 87% | 82% | 76% | 69% | 60% | 50% | 40% | 29% | 19% | 11% | 5% | 2% | 0% | 0% |
|---|
| 18 | 100% | 100% | 100% | 100% | 100% | 100% | 99% | 99% | 98% | 97% | 96% | 94% | 92% | 88% | 83% | 77% | 70% | 60% | 50% | 39% | 27% | 17% | 9% | 4% | 1% | 0% |
|---|
| 19 | 100% | 100% | 100% | 100% | 100% | 100% | 100% | 99% | 99% | 99% | 98% | 97% | 95% | 93% | 89% | 85% | 79% | 71% | 61% | 50% | 38% | 25% | 14% | 6% | 2% | 0% |
|---|
| 20 | 100% | 100% | 100% | 100% | 100% | 100% | 100% | 100% | 100% | 99% | 99% | 98% | 98% | 96% | 94% | 91% | 87% | 81% | 73% | 62% | 50% | 36% | 23% | 11% | 3% | 0% |
|---|
| 21 | 100% | 100% | 100% | 100% | 100% | 100% | 100% | 100% | 100% | 100% | 100% | 99% | 99% | 98% | 97% | 95% | 93% | 89% | 83% | 75% | 64% | 50% | 34% | 19% | 6% | 0% |
|---|
| 22 | 100% | 100% | 100% | 100% | 100% | 100% | 100% | 100% | 100% | 100% | 100% | 100% | 100% | 99% | 99% | 98% | 97% | 95% | 91% | 86% | 77% | 66% | 50% | 31% | 12% | 0% |
|---|
| 23 | 100% | 100% | 100% | 100% | 100% | 100% | 100% | 100% | 100% | 100% | 100% | 100% | 100% | 100% | 100% | 99% | 99% | 98% | 96% | 94% | 89% | 81% | 69% | 50% | 25% | 0% |
|---|
| 24 | 100% | 100% | 100% | 100% | 100% | 100% | 100% | 100% | 100% | 100% | 100% | 100% | 100% | 100% | 100% | 100% | 100% | 100% | 99% | 98% | 97% | 94% | 88% | 75% | 50% | 25% |
|---|
| 25 | 100% | 100% | 100% | 100% | 100% | 100% | 100% | 100% | 100% | 100% | 100% | 100% | 100% | 100% | 100% | 100% | 100% | 100% | 100% | 100% | 100% | 100% | 100% | 100% | 75% | 50% |
|---|
Any particular chance of winning can be easily read from the table. For instance, if the score is 15-7, look where row 15 and column 7 meet, and you'll find that the first team has a 94% chance of winning. (This is P(15, 7) in my notation.)
The table illustrates several interesting characteristics of scores. The odds fall away from 50% pretty rapidly as you move away from the diagonal (i.e. away from a tied score). Points matter a lot more near the end of the game, though: you've only got a 1% chance of winning from an 18-24 position, while being six points behind at the beginning (0-6) still gives you an 18% chance of winning. However, a big deficit is almost insurmountable - if you're behind 0-15, you have less than a 1% chance of catching up and winning. (Note that 0% and 100% in the table are not exactly 0% and 100%, because there's always some chance to win or lose.)
Note that each score is the average of the score below and the score to the right - these are the cases where the first team gets the point and the second team gets the point. This corresponds directly to the equation above.
The table could be extended arbitrarily far if neither team gets a two point lead, but those cases are not particularly interesting.
Generating the score table with dynamic programming
To generate the table, I wrote a simple Arc program to solve the recurrence equation using
dynamic programming:
(def scorePercent (s1 s2 max)
  (if (and (>= s1 max) (>= s1 (+ s2 2))) 100.
      (and (>= s2 max) (>= s2 (+ s1 2))) 0
      (is s1 s2) 50.
      (/ (+ (scorePercent s1 (+ s2 1) max)
            (scorePercent (+ s1 1) s2 max)) 2)))
The first two arguments are the current score, and the last argument is the amount to win (25 in this case). For instance:
arc> (scorePercent 24 22 25)
87.5
arc> (scorePercent 20 22 25)
22.65625
Unfortunately, the straightforward way of solving the problem has a severe performance problem. For instance, computing (scorePercent 5 7 25) takes hours and hours. The problem is that evaluating P(5, 7) requires calculating two cases: P(6, 7) and P(5, 8). Each of those requires two cases, each of which requires two cases, and so on. The result is an exponential number of evaluations, which takes a very very long time as the scores get lower. Most of these evaluations calculate the same values over and over, which is just wasted work. For instance, P(6, 8) is computed in order to compute P(6, 7) and P(6, 8) is computed again in order to compute P(5, 8).
There are a couple ways to improve performance. The hard way of solving the dynamic programming problem without this exponential blowup is to carefully determine an order in which each value can be calculated exactly once by working backwards, until you end up with the desired value. For instance, if the values are calculated going up the columns from right to left, each value can be computed immediately from two values that have already been computed, until we end up efficiently computing the whole table in approximately 25*25 steps. This requires careful coding to step through the table in the right order and to save each result as it is calculated. It's not too hard, but there's a much easier way.
The easy way of solving the problem is with memoization - when an intermediate value is calculated, remember its value in case you need it again, instead of calculating it over and over. With memoization, we can compute the results in any order we want, and automatically each result will only be computed once.
In Arc, memoization can be implemented simply by defining a function with defmemo, which will automatically memoize the results of the function evaluation:
(defmemo scorePercent (s1 s2 max)
  (if (and (>= s1 max) (>= s1 (+ s2 2))) 100.
      (and (>= s2 max) (>= s2 (+ s1 2))) 0
      (is s1 s2) 50.
      (/ (+ (scorePercent s1 (+ s2 1) max)
            (scorePercent (+ s1 1) s2 max)) 2)))
With this simple change, results are nearly instantaneous, rather than taking hours.
The above function generates a single entry in the table. To generate the full table in HTML with colored cells, I used a simple loop and Arc's HTML generating operations. If you're interested in Arc programming, the full code can be downloaded here.
Mathematical analysis
Instead of computing the probabilities through dynamic programming, it is possible to come up with a mathematical solution. After studying the values for a while, I realized rather surprisingly that the probabilities are closely tied to
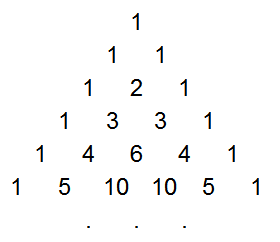
Pascal's Triangle. You may be familiar with Pascal's Triangle, where each element is the sum of the two elements above it (with 1's along the edges), forming a table of binomial coefficients:
Pascal's Triangle
The game probabilities come from the triangle of partial sums of binomial coefficients, which is a lesser-known sequence that is easily derived from Pascal's Triangle. This sequence, T(n, k) is formed by summing the first k elements in the corresponding row of Pascal's Triangle. That is, the first element is the first element in the same row of Pascal's triangle, the second is the sum of the first two elements in Pascal's triangle, the third is the sum of the first three, etc.
T - the partial row sums of Pascal's Triangle
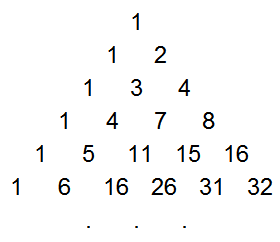
Mathematically, this triangle T(n, k) is defined by:
 =\sum_{i=0}^{k}\binom{n}{i} "\fn_phv T(n, k) =\sum_{i=0}^{k}\binom{n}{i}")
As with Pascal's Triangle, each element is the sum of the two above it, but now the right-hand border is powers of 2. This triangle is discussed in detail in the
Online Encyclopedia of Integer Sequences. Surprisingly, this triangle is closely connected with distances in a hypercube,
error-correcting codes, and
how many pieces an n-dimensional cake can be cut into.
With function T defined above, the volleyball winning probabilities are given simply by:
 = \frac{T(a+b-1,b-1)}{2^{a+b-1}} = \frac {\sum_{i=0}^{b-1}\binom{a+b-1}{i}}{2^{a+b-1}} "\fn_phv P(25-a, 25-b) = \frac{T(a+b-1,b-1)}{2^{a+b-1}} = \frac {\sum_{i=0}^{b-1}\binom{a+b-1}{i}}{2^{a+b-1}}")
For example, P(23,20) = T(6, 4)/2^6 = 89.0625%, which matches the table.
Intuitively, it makes sense that the probabilities are related to Pascal's Triangle, because each entry in Pascal's Triangle is the sum of the two values above, while each probability entry is the average of the value above and the value to the right in the table. Because taking the average divides by 2 in each step, an exponent of 2 appears in the denominator. The equation can be proved straightfowardly by induction.
The importance of a point
Suppose the score is m to n. How important is the next point? I'll consider the importance of the point to be how much more likely the team is to win the game if they win the point versus losing the point. For instance, suppose the score is 18-12, so the first team has a 92% chance of winning (from the previous table). If they win the next point, their chance goes up to 95%, while if they lose the point, their chance drops to 88%. Thus, we'll consider the importance to be 7%. Mathematically, if the score is m to n, I define the importance as P(m+1, n) - P(m, n+1).
Table with importance of the next point when the score is m to n
| 0 | 1 | 2 | 3 | 4 | 5 | 6 | 7 | 8 | 9 | 10 | 11 | 12 | 13 | 14 | 15 | 16 | 17 | 18 | 19 | 20 | 21 | 22 | 23 | 24 | 25 |
|---|
| 0 | 11% | 11% | 11% | 11% | 10% | 9% | 8% | 7% | 6% | 5% | 4% | 3% | 2% | 1% | 1% | 0% | 0% | 0% | 0% | 0% | 0% | 0% | 0% | 0% | 0% | 0% |
|---|
| 1 | 11% | 12% | 12% | 11% | 11% | 10% | 9% | 8% | 7% | 6% | 4% | 3% | 2% | 2% | 1% | 1% | 0% | 0% | 0% | 0% | 0% | 0% | 0% | 0% | 0% | 0% |
|---|
| 2 | 11% | 12% | 12% | 12% | 12% | 11% | 10% | 9% | 8% | 7% | 6% | 4% | 3% | 2% | 2% | 1% | 1% | 0% | 0% | 0% | 0% | 0% | 0% | 0% | 0% | 0% |
|---|
| 3 | 11% | 11% | 12% | 12% | 12% | 12% | 11% | 10% | 9% | 8% | 7% | 5% | 4% | 3% | 2% | 1% | 1% | 0% | 0% | 0% | 0% | 0% | 0% | 0% | 0% | 0% |
|---|
| 4 | 10% | 11% | 12% | 12% | 13% | 13% | 12% | 12% | 11% | 9% | 8% | 7% | 5% | 4% | 3% | 2% | 1% | 1% | 0% | 0% | 0% | 0% | 0% | 0% | 0% | 0% |
|---|
| 5 | 9% | 10% | 11% | 12% | 13% | 13% | 13% | 13% | 12% | 11% | 10% | 8% | 7% | 5% | 4% | 3% | 2% | 1% | 1% | 0% | 0% | 0% | 0% | 0% | 0% | 0% |
|---|
| 6 | 8% | 9% | 10% | 11% | 12% | 13% | 13% | 13% | 13% | 12% | 11% | 10% | 8% | 6% | 5% | 3% | 2% | 1% | 1% | 0% | 0% | 0% | 0% | 0% | 0% | 0% |
|---|
| 7 | 7% | 8% | 9% | 10% | 12% | 13% | 13% | 14% | 14% | 13% | 12% | 11% | 10% | 8% | 6% | 5% | 3% | 2% | 1% | 1% | 0% | 0% | 0% | 0% | 0% | 0% |
|---|
| 8 | 6% | 7% | 8% | 9% | 11% | 12% | 13% | 14% | 14% | 14% | 14% | 13% | 11% | 10% | 8% | 6% | 4% | 3% | 2% | 1% | 0% | 0% | 0% | 0% | 0% | 0% |
|---|
| 9 | 5% | 6% | 7% | 8% | 9% | 11% | 12% | 13% | 14% | 14% | 14% | 14% | 13% | 12% | 10% | 8% | 6% | 4% | 3% | 1% | 1% | 0% | 0% | 0% | 0% | 0% |
|---|
| 10 | 4% | 4% | 6% | 7% | 8% | 10% | 11% | 12% | 14% | 14% | 15% | 15% | 14% | 13% | 12% | 10% | 8% | 6% | 4% | 2% | 1% | 1% | 0% | 0% | 0% | 0% |
|---|
| 11 | 3% | 3% | 4% | 5% | 7% | 8% | 10% | 11% | 13% | 14% | 15% | 15% | 15% | 15% | 14% | 12% | 10% | 7% | 5% | 3% | 2% | 1% | 0% | 0% | 0% | 0% |
|---|
| 12 | 2% | 2% | 3% | 4% | 5% | 7% | 8% | 10% | 11% | 13% | 14% | 15% | 16% | 16% | 15% | 14% | 12% | 10% | 7% | 5% | 3% | 1% | 1% | 0% | 0% | 0% |
|---|
| 13 | 1% | 2% | 2% | 3% | 4% | 5% | 6% | 8% | 10% | 12% | 13% | 15% | 16% | 17% | 17% | 16% | 14% | 12% | 9% | 7% | 4% | 2% | 1% | 0% | 0% | 0% |
|---|
| 14 | 1% | 1% | 2% | 2% | 3% | 4% | 5% | 6% | 8% | 10% | 12% | 14% | 15% | 17% | 18% | 18% | 17% | 15% | 12% | 9% | 6% | 3% | 2% | 1% | 0% | 0% |
|---|
| 15 | 0% | 1% | 1% | 1% | 2% | 3% | 3% | 5% | 6% | 8% | 10% | 12% | 14% | 16% | 18% | 19% | 19% | 17% | 15% | 12% | 9% | 5% | 3% | 1% | 0% | 0% |
|---|
| 16 | 0% | 0% | 1% | 1% | 1% | 2% | 2% | 3% | 4% | 6% | 8% | 10% | 12% | 14% | 17% | 19% | 20% | 20% | 18% | 16% | 12% | 8% | 4% | 2% | 0% | 0% |
|---|
| 17 | 0% | 0% | 0% | 0% | 1% | 1% | 1% | 2% | 3% | 4% | 6% | 7% | 10% | 12% | 15% | 17% | 20% | 21% | 21% | 19% | 16% | 12% | 7% | 3% | 1% | 0% |
|---|
| 18 | 0% | 0% | 0% | 0% | 0% | 1% | 1% | 1% | 2% | 3% | 4% | 5% | 7% | 9% | 12% | 15% | 18% | 21% | 23% | 23% | 21% | 16% | 11% | 5% | 2% | 0% |
|---|
| 19 | 0% | 0% | 0% | 0% | 0% | 0% | 0% | 1% | 1% | 1% | 2% | 3% | 5% | 7% | 9% | 12% | 16% | 19% | 23% | 25% | 25% | 22% | 16% | 9% | 3% | 0% |
|---|
| 20 | 0% | 0% | 0% | 0% | 0% | 0% | 0% | 0% | 0% | 1% | 1% | 2% | 3% | 4% | 6% | 9% | 12% | 16% | 21% | 25% | 27% | 27% | 23% | 16% | 6% | 0% |
|---|
| 21 | 0% | 0% | 0% | 0% | 0% | 0% | 0% | 0% | 0% | 0% | 1% | 1% | 1% | 2% | 3% | 5% | 8% | 12% | 16% | 22% | 27% | 31% | 31% | 25% | 12% | 0% |
|---|
| 22 | 0% | 0% | 0% | 0% | 0% | 0% | 0% | 0% | 0% | 0% | 0% | 0% | 1% | 1% | 2% | 3% | 4% | 7% | 11% | 16% | 23% | 31% | 38% | 38% | 25% | 0% |
|---|
| 23 | 0% | 0% | 0% | 0% | 0% | 0% | 0% | 0% | 0% | 0% | 0% | 0% | 0% | 0% | 1% | 1% | 2% | 3% | 5% | 9% | 16% | 25% | 38% | 50% | 50% | 25% |
|---|
| 24 | 0% | 0% | 0% | 0% | 0% | 0% | 0% | 0% | 0% | 0% | 0% | 0% | 0% | 0% | 0% | 0% | 0% | 1% | 2% | 3% | 6% | 12% | 25% | 50% | 50% | 50% |
|---|
| 25 | 0% | 0% | 0% | 0% | 0% | 0% | 0% | 0% | 0% | 0% | 0% | 0% | 0% | 0% | 0% | 0% | 0% | 0% | 0% | 0% | 0% | 0% | 0% | 25% | 50% | 50% |
|---|
The values in the table make intuitive sense. If one team is winning by a lot, one more point doesn't make much difference. But if the scores are close, then each point counts. Each point counts a lot more near the end of the game than at the beginning. The first point only makes an 11% difference in the odds of winning, while the if the score is 23-23, the point makes a 50% difference (75% chance of winning if you get the point vs 25% if you miss the point). This table is sort of a derivative of the first table, showing where the values are changing most rapidly.
The importance of a point as defined above closely matches the behavior of the spectators. If the score is very close at the end of the game, the audience becomes much more animated compared to earlier in the game.
The "importance" is mathematically simpler than the probability of winning derived earlier. If the current score is 25-a, 25-b, then the importance is given by the simple equation:

This can proved straighforwardly from the equation for P(x, y). For example, if the score is 18-12, the importance is C(7+13-2, 6) / 2^(7+13-2) = 18564 / 262144 = 7.08%.
Conclusions
How useful is this model? Well, it depends on the assumption that each team has an equal chance of winning each point. Of course, most teams are not evenly matched. Even more important is the fact that if a team has a good server, they can quickly rack up 10 points in a row, which throws the model out the window.
However, I think the model is still useful, since it provides some quantitative answers to the original questions, and confirms some intuitions. In addition, the mathematics turned out to be more interesting than I was expecting, with the surprising connection to Pascal's Triangle.
Python version
P.S. The code above is in Arc, an obscure language. Here's a version of the code in Python that will be more useful:
solved = {} # Remember values that have been solved

# Compute probability of team 1 wining when score is s1 to s2.
# Max is the points needed to win (typically 25)
# This routine is just a wrapper around scorePercentInt to
# remember values that have been computed.
def scorePercent(s1, s2, max):
  if (s1, s2, max) not in solved:
    solved[s1, s2, max] = scorePercentInt(s1, s2, max)
  return solved[s1, s2, max]

# This routine does the actual calculation
def scorePercentInt(s1, s2, max):
  if s1 >= max and s1 >= s2 + 2: return 100
  if s2 >= max and s2 >= s1 + 2: return 0
  if s1 == s2: return 50
  return (scorePercent(s1, s2+1, max) + scorePercent(s1+1, s2, max)) / 2.

for i in range(0, 26):
  for j in range(0, 26):
    print '%.3f' % scorePercent(i, j, 25),
  print